CARR for Counties
The county CARR data in .csv and STATA .dta format, and the metadata for these files, can be downloaded here. This data will also be published and available for download at the long-term data repository Zenodo.
A file containing the basic descriptive analysis and visualizations provided below can be downloaded here.
To operationalize CARR for county boundaries we computed area-weighted averages of the original block-group scale CARR. In addition to presenting the area weighted average CARR scores, we also independently calculated area weighted averages for each constituent component of CARR. U.S. census urban-rural categorizations and USDA ERS rural urban continuum code (RUCC) classifications were summarized by taking the mode across all block groups intersecting with a county. Note: RUCC was originally constructed for U.S. counties, so in this case the modal operation should simply return the original RUCC class.
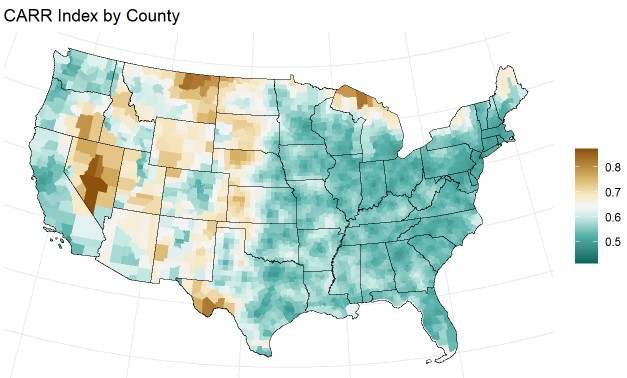
The values of the county CARR scores fall within the original range of CARR scores (0-1), where a value of 0 means very urban with high concentrations of services and amenities and a value of 1 means very rural with low concentrations of services and amenities.
However, the distribution of CARR by counties is shifted towards higher scores and the range is compressed (as should be expected from the aggregation process). The minimum score is 0.41, the maximum score is 0.87, and the mean score is 0.57. (In the original CARR the mean value was ~0.5.)

The spatial distribution of CARR across U.S. counties is consistent with the original CARR.

Like the original CARR the index values indicate generally higher values of CARR in census designated rural areas but with a large degree of overlap in urban and rural CARR scores.

In addition, the county CARR scores generally tend to increase with increasing rurality in terms of RUCC but with large amounts of overlap.

The availability component spatial distribution is consistent with the original CARR. Larger values of this component, which has an inverse relationship to the final CARR score, are associated with greater density of services and amenities and are generally found in more developed metropolitan areas. Note that this component has a highly skewed distribution and is log transformed for visualization purposes.

The three accessibility components’ spatial distributions are consistent with the original CARR as well. Larger values of the first accessibility factor are associated with greater distances to amenities. Larger values of the second accessibility factor are associated with increased distance to essential services. Larger values of the third accessibility factor are associated with greater distances to both amenities and natural resource extraction (e.g. peri-urban).


We also see that the relationships between county CARR and population density, distance to metro areas, and developed land cover meet expectations. CARR has a negative relationship with population density and developed land cover and a positive relationship with distance to metro areas.


References
Reuse
Kate Nelson
Associate Professor
My research interests include landscape diversity, agricultural adaptation, strategic retreat, vulnerability assessment, and scaling relationships.